The Evolution of Modern BAS Graphics
The evolution of building automation graphics has been significant, driven by advances in technology, rising user expectations, and the growing skillsets of the professionals creating these user interfaces. Initially, building automation systems relied on basic, text-based graphics with limited visual appeal, offering straightforward, functional displays that focused on data presentation rather than user experience. These early systems were often challenging to navigate, requiring specialized knowledge to interpret and operate effectively.
As technology advanced, so did the graphical capabilities of building automation systems. The introduction of 2D graphics marked a pivotal shift, allowing for more intuitive representations of building layouts, system components, and operational statuses. These early 2D interfaces, though still relatively simple, provided users with a clearer, more accessible way to interact with their building systems, making the technology more approachable for a broader range of operators.
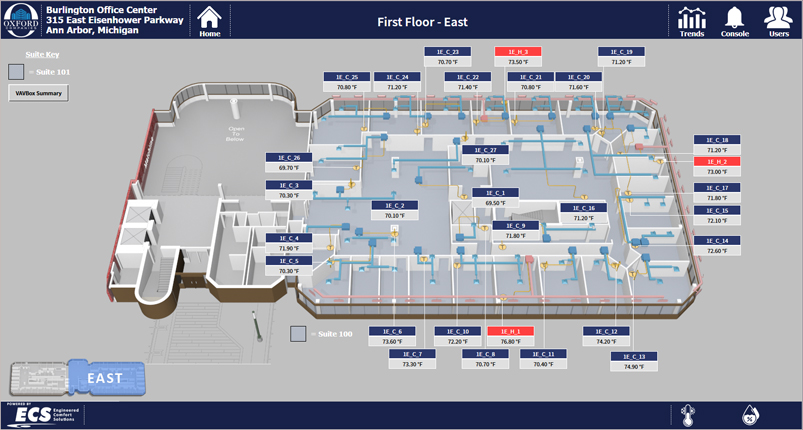
The real leap forward came with the advent of 3D graphics and real-time visualization. These developments were made possible by the increasing power of computers and graphic processors, which enabled the creation of detailed, dynamic representations of buildings and their internal systems. With 3D graphics, operators could view lifelike models of their buildings, complete with real-time data overlays that showed changes in temperature, energy consumption, and system performance as they happened. This level of detail and interactivity not only improved the accuracy of monitoring and control but also made the systems more engaging and easier to use.
Parallel to these technological advances was the evolution of user expectations. As people became more accustomed to high-quality, visually appealing interfaces in consumer technology, they began to demand the same from building automation systems. This shift pushed developers to focus on creating more user-friendly, visually compelling graphics that not only conveyed information effectively but also provided a pleasant and intuitive user experience. Touchscreens, customizable dashboards, and interactive elements became standard, allowing users to tailor the system to their specific needs and preferences.
At the same time, the skillsets of the individuals designing these interfaces evolved. Early building automation graphics were often created by engineers with a focus on functionality over form. However, as the importance of user experience became clear, a new breed of designers and developers entered the field, bringing with them expertise in UI/UX design, graphic design, and human-computer interaction. These professionals combined their artistic skills with technical knowledge to create interfaces that were not only powerful but also visually appealing and easy to navigate.
Today, the most advanced building automation graphics incorporate cutting-edge technologies like augmented reality (AR), virtual reality (VR), and AI-driven analytics. These interfaces offer immersive, interactive experiences that allow users to explore their buildings in unprecedented detail, predict potential issues before they arise, and make informed decisions based on real-time data. The result is a more holistic, user-centric approach to building management that reflects the latest technological trends and the ever-evolving expectations of users.
Looking forward, the continued evolution of building automation graphics will likely be shaped by further advancements in technology, including AI and machine learning, as well as ongoing improvements in design practices. As the industry continues to innovate, we can expect even more sophisticated, intuitive, and visually stunning interfaces that make managing complex building systems easier and more efficient than ever before.
